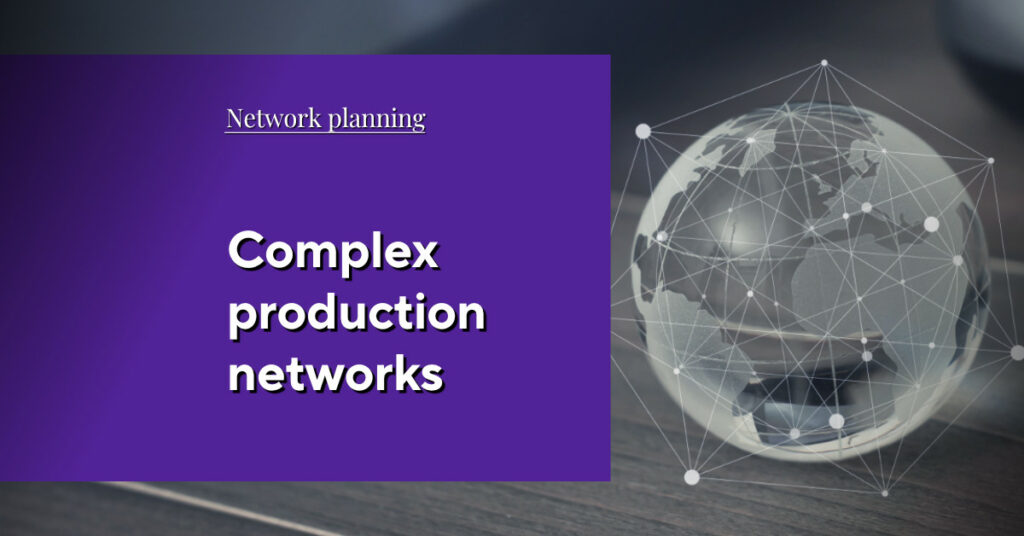
Optimized demand
forecasting using
predictive analytics

We’ve run out of paper!

How demand forecasting can benefit from Predictive Analytics.

One of the images we automatically associate with the COVID-19 crisis has to be that of empty supermarket shelves. For weeks on end you could hardly get hold of any non-perishable food, flour, pasta, or rice. Neither was there any disinfectant, nor were there medical masks and, yes, there was no toilet paper. Everyday products with a customary sales value of just a few cent or euro were suddenly being traded at x-times the price – if they could actually be purchased at all. Up until then, most western Europeans of the post-war generation had had the great fortune and privilege of only knowing about shortages from their history books – and all of a sudden, they were experiencing it themselves.

Be honest: who, at the onset of the pandemic in Germany, had seriously predicted that a virus, which mainly attacks the lungs, could have an impact on the sale of toilet paper of all things? Probably no one. And why? Because the link between a looming threat and our human instinct to protect ourselves and our families, has never once been considered in any demand forecasting model.

The limits of classic demand forecasting

When writing an article such as this one, there is always the risk of passing judgement. Terms like “classic” or “traditional” are rashly associated with “old-fashioned” or “backwards.” Such an observation is as false as it can possibly get. This is because classic methods such as time series forecasting have continued to prove their worth and reliability over the years and are comparatively easy to implement in companies. These work more accurately the less changes are made to the general setting. However, this is exactly where we can perceive their limits: the setting changes – faster and faster, and becomes more and more unpredictable. Yet what are the driving factors behind these changes?

Consumers can change their behavior fast and unexpectedly

The toilet paper example clearly shows that consumers do not always behave rationally. While hoarding food in times of crisis may be understandable behavior, the race for toilet paper seems rather absurd. Even the slightest rumor about the product becoming scarce made it a self-fulfilling prophecy.

Cross-dependencies go undetected

Perhaps this development could have been predicted after all? Let us assume for just one moment that an algorithm would have been able to analyze people’s buying behavior in life-threatening crisis situations. It might have established that such a surge in demand would be signalized by a change in certain indicators. Production and logistics would have been able to respond timely by extending their capacities.

Too many influencing factors

We all know that consumers’ buying habits depend on external factors. Any trade fair or exhibition business can tell you a thing or two about how good weather has a toxic effect on their ticket sales. Nowadays, more and more factors are coming into play, like social media influencers. Even before Corona, airlines were observing a decline in passenger numbers due to the “Flight Shame Movement”.

There’s no forecast without sufficient data

Classic forecasts go by the theory “history repeats itself”. But what if there wasn’t any history because a product or market is new? Admittedly, new forecasting methods also need data. Yet, would these be in a position to aggregate data from various similar markets or from competitors and search for patterns which can be applied to the new market?

Are you interested in our factsheet?

What are the benefits of mathematical optimization?

Viewing machine learning and Predictive Analytics as an opportunity

In particular by integrating a large number of data sources and identifying patterns and cross-dependencies, machine learning and Predictive Analytics can fully demonstrate their strengths. The close and periodic analysis of all influencing factors allows changes to be detected at an early stage from which adjustments to demand planning can be timely derived. In this way, models learn continuously and improve the quality of the prediction with each iteration. But as we have already mentioned, a lot depends on the type and availability of the data to be analyzed. This is why we would like to take a look at this more closely below.


Structured internal data

Internal sources are the most valuable ones when it comes to extracting data due to their accessbility and constant availability – in theory. In practice it is often the case that it first needs to be collected from various systems and then prepared. Ideally, this process is automatized for operational use and data exchange takes place across interfaces. Such time and effort can deter a lot of companies yet it more than pays off in the form of increased forecast quality.

Examples of structured internal data

  • Orders (initial/repeat orders)
  • Sales (over the course of time)
  • CRM information (Marketing and Sales activity)
  • Customer Service

Structured external data

Internal data can be complemented by external data sources. By including meteorological data we can analyze demand depending on the weather and consider this in future demand forecasts.

Examples of structured external data

  • Weather reports
  • Socio-demographic data and typologies
  • Statistical data
  • Panels

Unstructured internal data

In the case of unstructured data it is not always easy to differentiate between relevant and irrelevant data. While standardized reviews and ratings are fairly easy to evaluate on your own website, this is more difficult when it comes to comments. These would have to be checked and categorized manually or a semantic algorithm would be required which is in a position to understand and evaluate the significance of the comment. Depending on the importance of this data for the model- or the amount of data generated, one or the other may make more sense.

Examples of unstructured internal data:

  • Comments on the website
  • Ratings on the website
  • Website KPIs /click rate
  • Evaluations from marketing campaigns

Unstructured external data

What is already difficult concerning internal data becomes somewhat more complex when it comes to external data. However, it can be useful to filter social media for opinions, comments or videos on your own brand or product. Are any demand trends evident or can a decline in orders be anticipated?

Examples of unstructured internal data:

  • Social Media
  • Geolocations

How do Machine Learning and Predictive Analytics work together?

As we have read above, data is the key to successful demand forecasting. To be more precise, we could say: the solution is hidden among a wealth of data. This is where Machine Learning can really play out its full potential. Not only does it process a vast amount of data in a short time, the algorithm recognizes patterns and cross-dependencies far better than any human ever could – especially when this involves unstructured external data which is becoming more and more important for forecasting. But how does machine learning work exactly? Let us explain this process step by step.

1. Collect the data

Relevant data sources are identified. Here, the quality and completeness of the data is of particular importance.

2. Prepare the data

The better the data has been prepared, the better the result. Datasets are completed, where possible, and put into a consistent form in order to be processed further. This step accounts for a large part of the initial work in setting up a machine learning algorithm.

3. Training the algorithm

Once the prepared data is available, it is separated into sets. The larger one makes up the training set with which the algorithm will eventually be trained. The remaining data is distributed into “test” and “validation” fields. Validation data is important to ensure that the algorithm really can work with the unknown data and provide valid results. The data used is representative, of course, and the separation into groups is randomized.

4. Testing the algorithm

The test is conducted based on the validation data. If this does not produce a satisfactory result, the algorithm will continue to be improved. (see 5).

5. Improving the algorithm

The algorithm is continuously improved in order to achieve the accuracy required. Perhaps further data is needed, perhaps the algorithm itself has to be amended or even has to be changed entirely. OPTANO has developed its own free- of-charge tool which can considerably speed up this process

Once the optimal machine learning algorithm has been found, there is nothing standing in the way of demand forecasting with the aid of Predictive Analytics. By constantly monitoring all of the relevant influential factors, precise forecasts can be made and be responded to accordingly. To sum up: the more volatile the demand, the more identified and assumed cross-dependencies there are and the more short-term planning cycles you have in your market, then the sooner you should be thinking about machine learning and Predictive Analytics for demand forecasting.

More interesting articles

Many factors influence consumer behavior. We show you how to improve your forecasts with Predictive Analytics.

Read more »

With mathematical optimization discrepancies between the sales forecast and the actual sales can be considerably reduced and the planning quality improved.

Read more »

We talk to our Head of Products about future exciting features and functions of our products and innovations.

Read more »

Would Predictive Analytics models have been able to predict the toilet paper shortage?

In retrospect such a question is barely admissible but let us run through the scenario all the same: if we could have been able to train an algorithm beforehand by using relevant data on consumer behavior in crisis situations and if the relevant data were connected: then the answer might be yes; in particular if we had succeeded in including external sources such as a systematic evaluation of social media activities.

Maybe the increae in sales of certain food would have alarmed the algorithm. It would have known from experience that such an increase means that people are highly likely to cover their requirements to withstand a crisis – and that toilet paper also belongs to this category. The first real purchase data might have shown that the share of toilet paper per purchase had increased successively. A systematic evaluation of social media activities would have shown that at some point the population was worried about a supply bottleneck. If, due to constant monitoring, these factors had indicated that the tendency of all factors was increasing, the model would have predicted the increase in demand and, under due consideration of current capacities, would have been able to predict the shortage.

Would Machine Learning and Predictive Analytics also have been able to suggest which capacity adjustments would have had to be made to counter the shortage?

No. But with the help of their “big sister”, Prescriptive Analytics, this would have been possible. How Predictive and Prescriptive Analytics work hand in hand can be seen in our short presentation on our Predictive Blueprint. (see below).


Do you already know our factsheet on this topic?

In our factsheet “What are the benefits of mathematical optimization?” we ask 5 questions to help you assess whether mathematical optimization brings benefits to your organization.

To obtain our factsheet, all you need to do is enter your contact details in the space below. A pop-up window will then open to download the whitepaper. Please note that by providing us with your email address, you agree that we may contact you on this topic. You may revoke this agreement at any time by contacting privacy@optano.com.

Michael Osterkamp
Michael Osterkamp

Do you have any questions?

Denise Lelle
Business Development
Manager