The solution for
time-critical parcel and
logistics networks
Optimize your parcel network with OPTANO
Managing parcel networks holistically — from pick-up through middle-mile to delivery — can be a challenging task. What is your optimal sorting and cross-docking footprint considering number, location and size? What level of automation is required for efficient operations? How can you optimize your linehaul routes to allow for maximum utilization? Should you co-produce or prioritize specific services? The transparency required to balance demands and capacities amid fluctuating volumes and product mixes is frequently missing, complicating efforts to remain competitive.
Adopting a comprehensive approach to parcel network optimization is crucial for maintaining efficiency and remaining flexible to changes. Given the complexity of parcel networks, altering only individual components is insufficient for achieving sustainable cost reductions.
OPTANO offers a network optimization software specifically designed for courier, express and parcel service providers, utilizing mathematical decision support and artificial intelligence. Rapid scenario calculations, powerful visualizations, and efficient scenario management allow to reveal untapped potential in your network. By incorporating factors such as a full-week schedule, door-constraints, multi-stop routes, shift windows for equipment capacities, and more, OPTANO provides the necessary transparency to handle additional volumes while maintaining cost-effectiveness and flexibility, thereby ensuring your network is future-proof.
Managing parcel networks from pick-up to delivery can be complex. Optimizing sorting, cross-docking, automation, linehaul routes, and services while balancing demands and capacities is crucial for competitiveness. OPTANO’s network optimization software enables courier, express, and parcel service providers to efficiently make decisions using mathematical support and AI, ensuring cost-effectiveness and flexibility.
The OPTANO solution for parcel networks
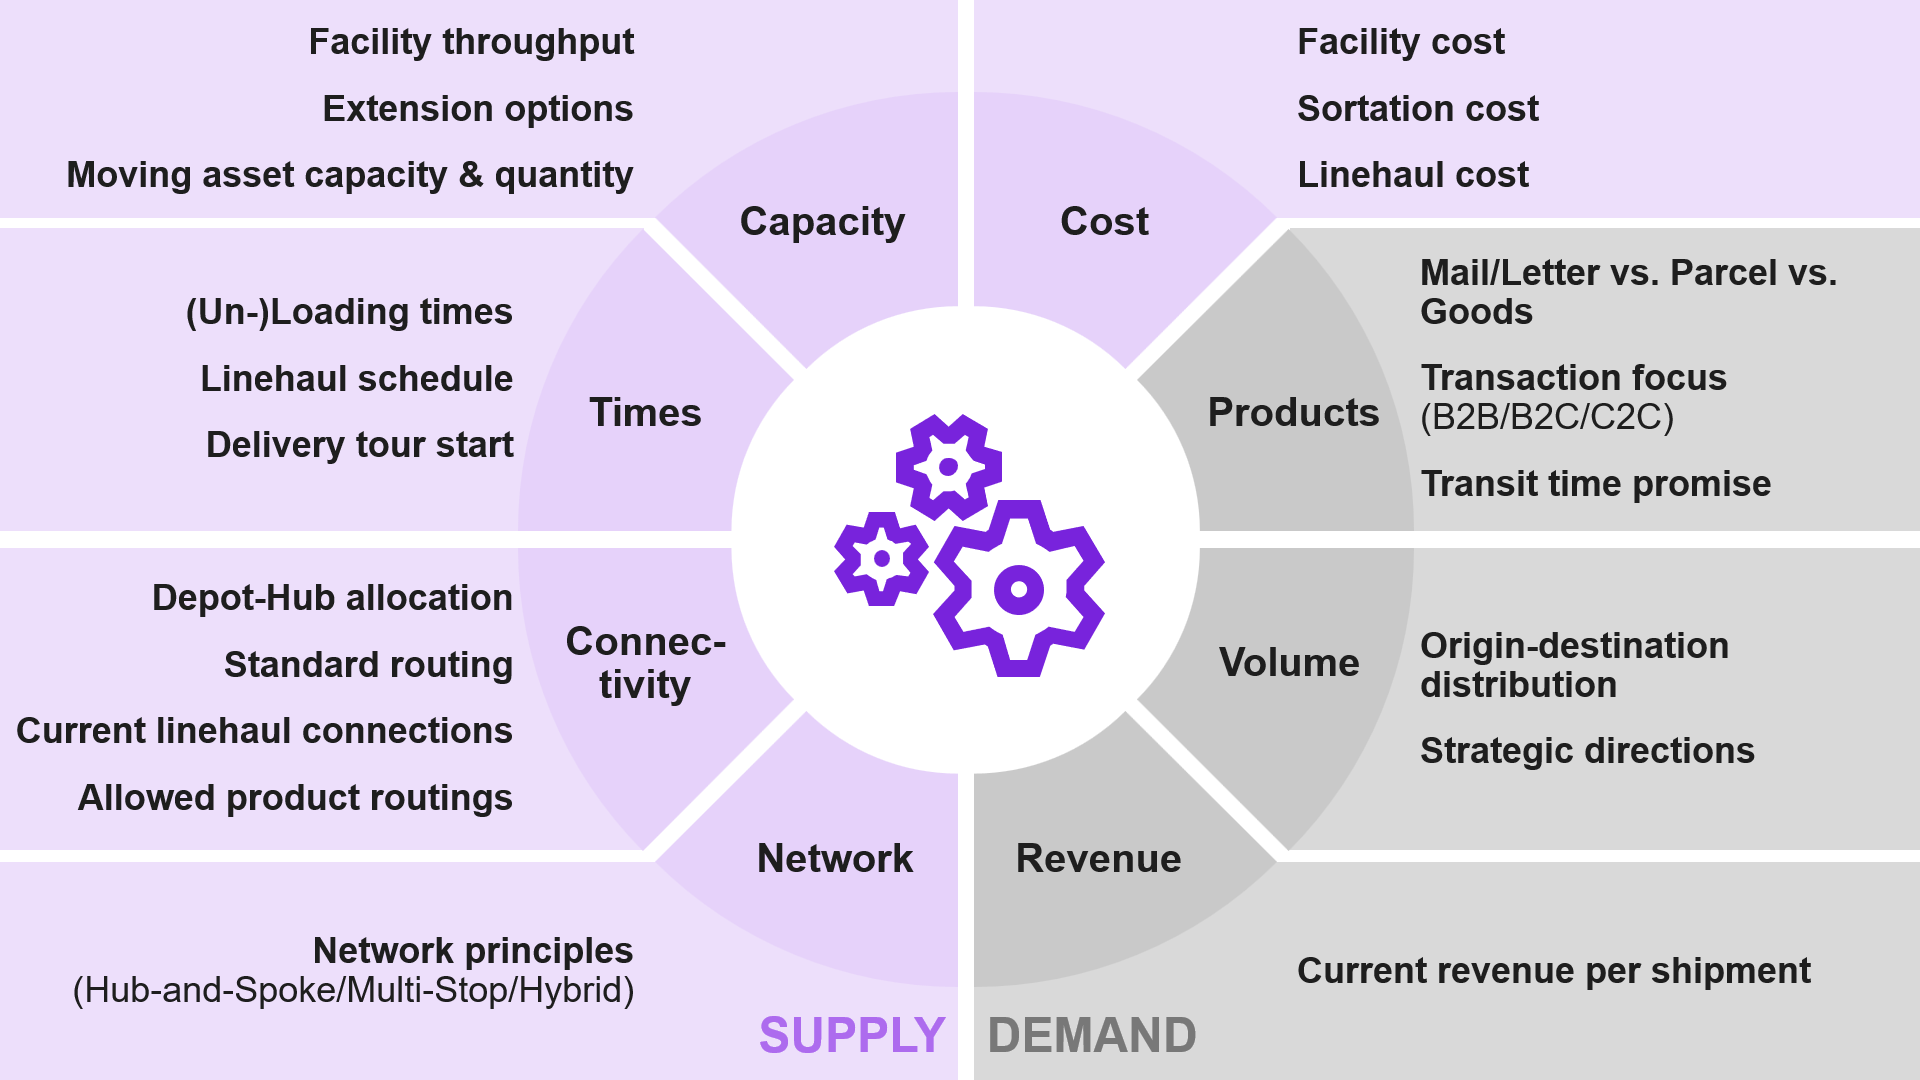
OPTANO allows to evaluate multiple levers simultaneously and explore their combined potential along the entire value chain. Examples of levers include the adjustment of service commitments, revision of deployed capacity, leveraging of external capacity, enablement of shared product handling, and more. The OPTANO data model allows to capture these considerations along eight categories for supply and demand of the network. The optimization model dynamically allocates demand to supply options and chooses routings through the network based on availability, capacity and timely connectivity, allowing users to derive the combination of levers leading to the biggest impact.
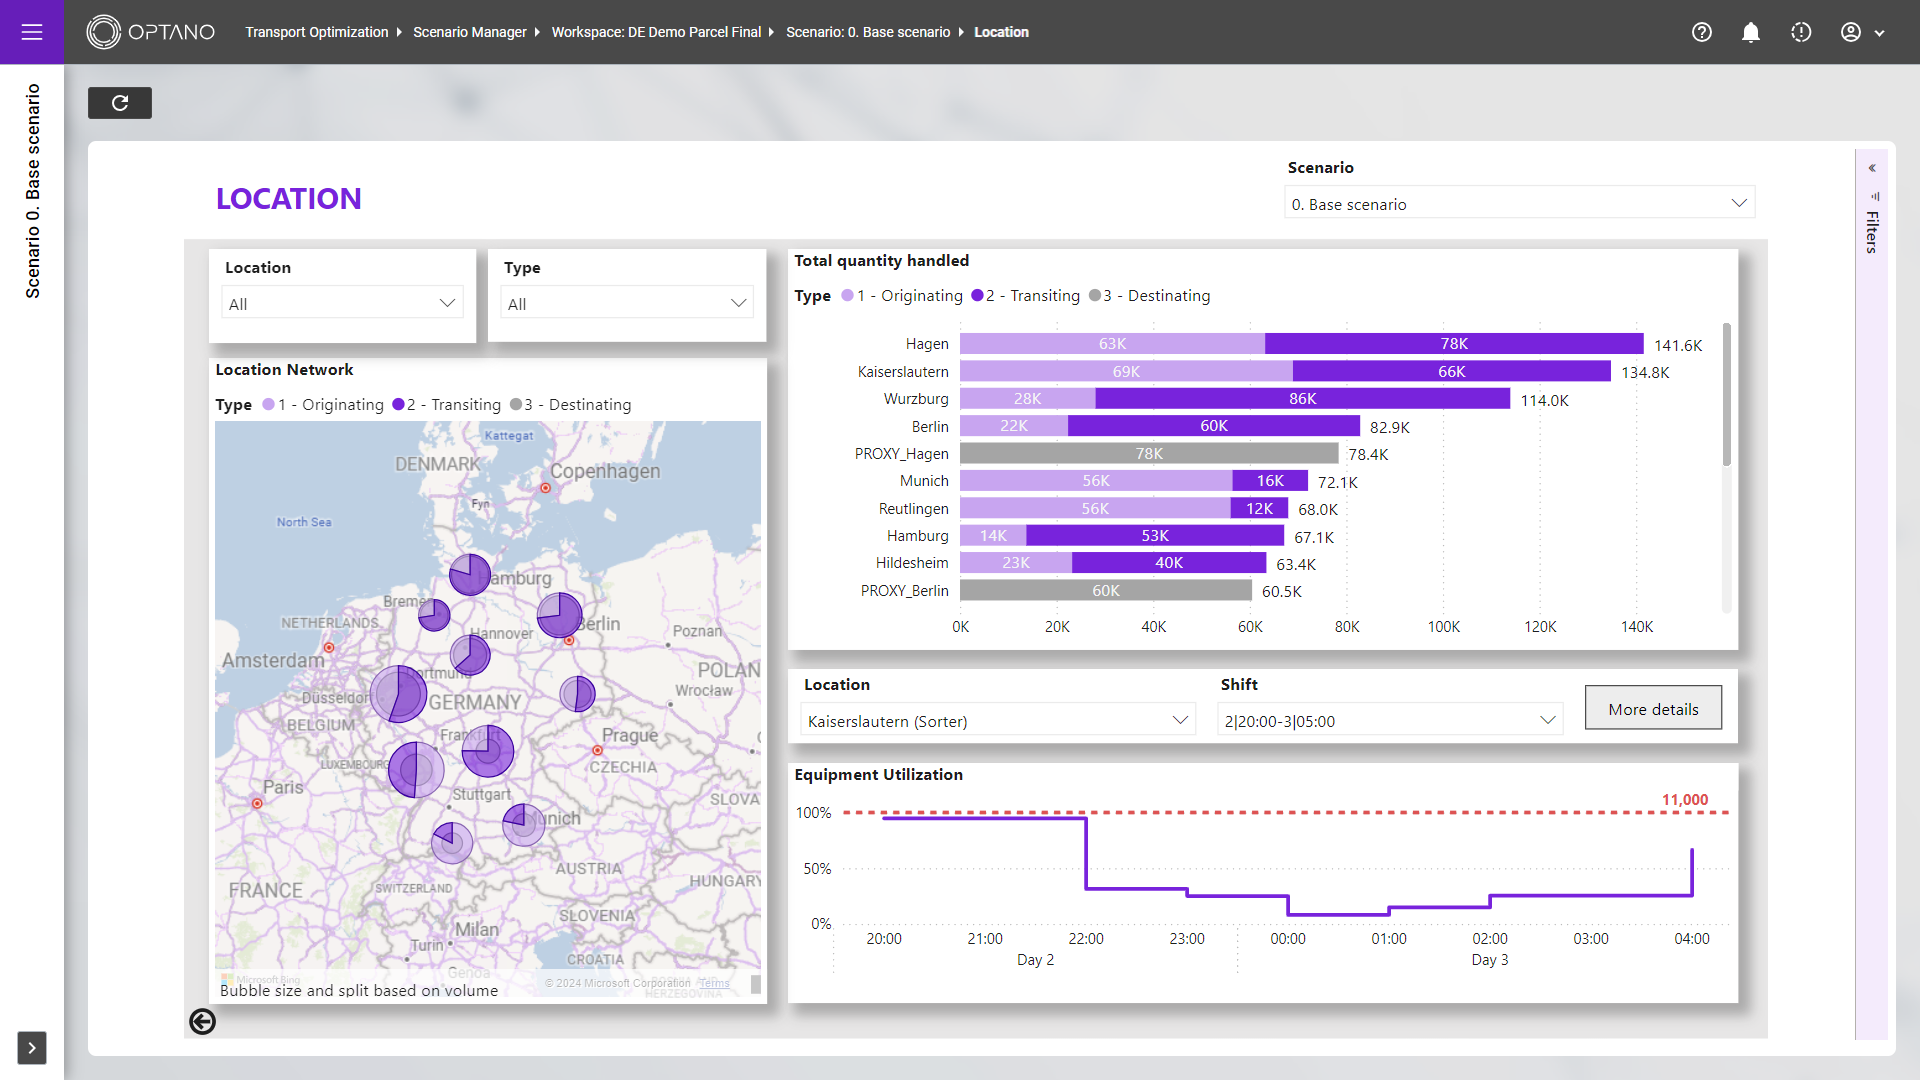
With insights into equipment capacity, this feature enables detailed analysis of hub utilization and allows to identify potential bottlenecks within a specific hub. Model inputs and optimization output enable an in-depth examination of facility capacity. Using the optimization results, users can develop measures to promote future-proof hub design based on a comparison of different volume scenarios. In addition, conclusions about productivity and potential automation needs can be derived based on current hub utilization.
Factors
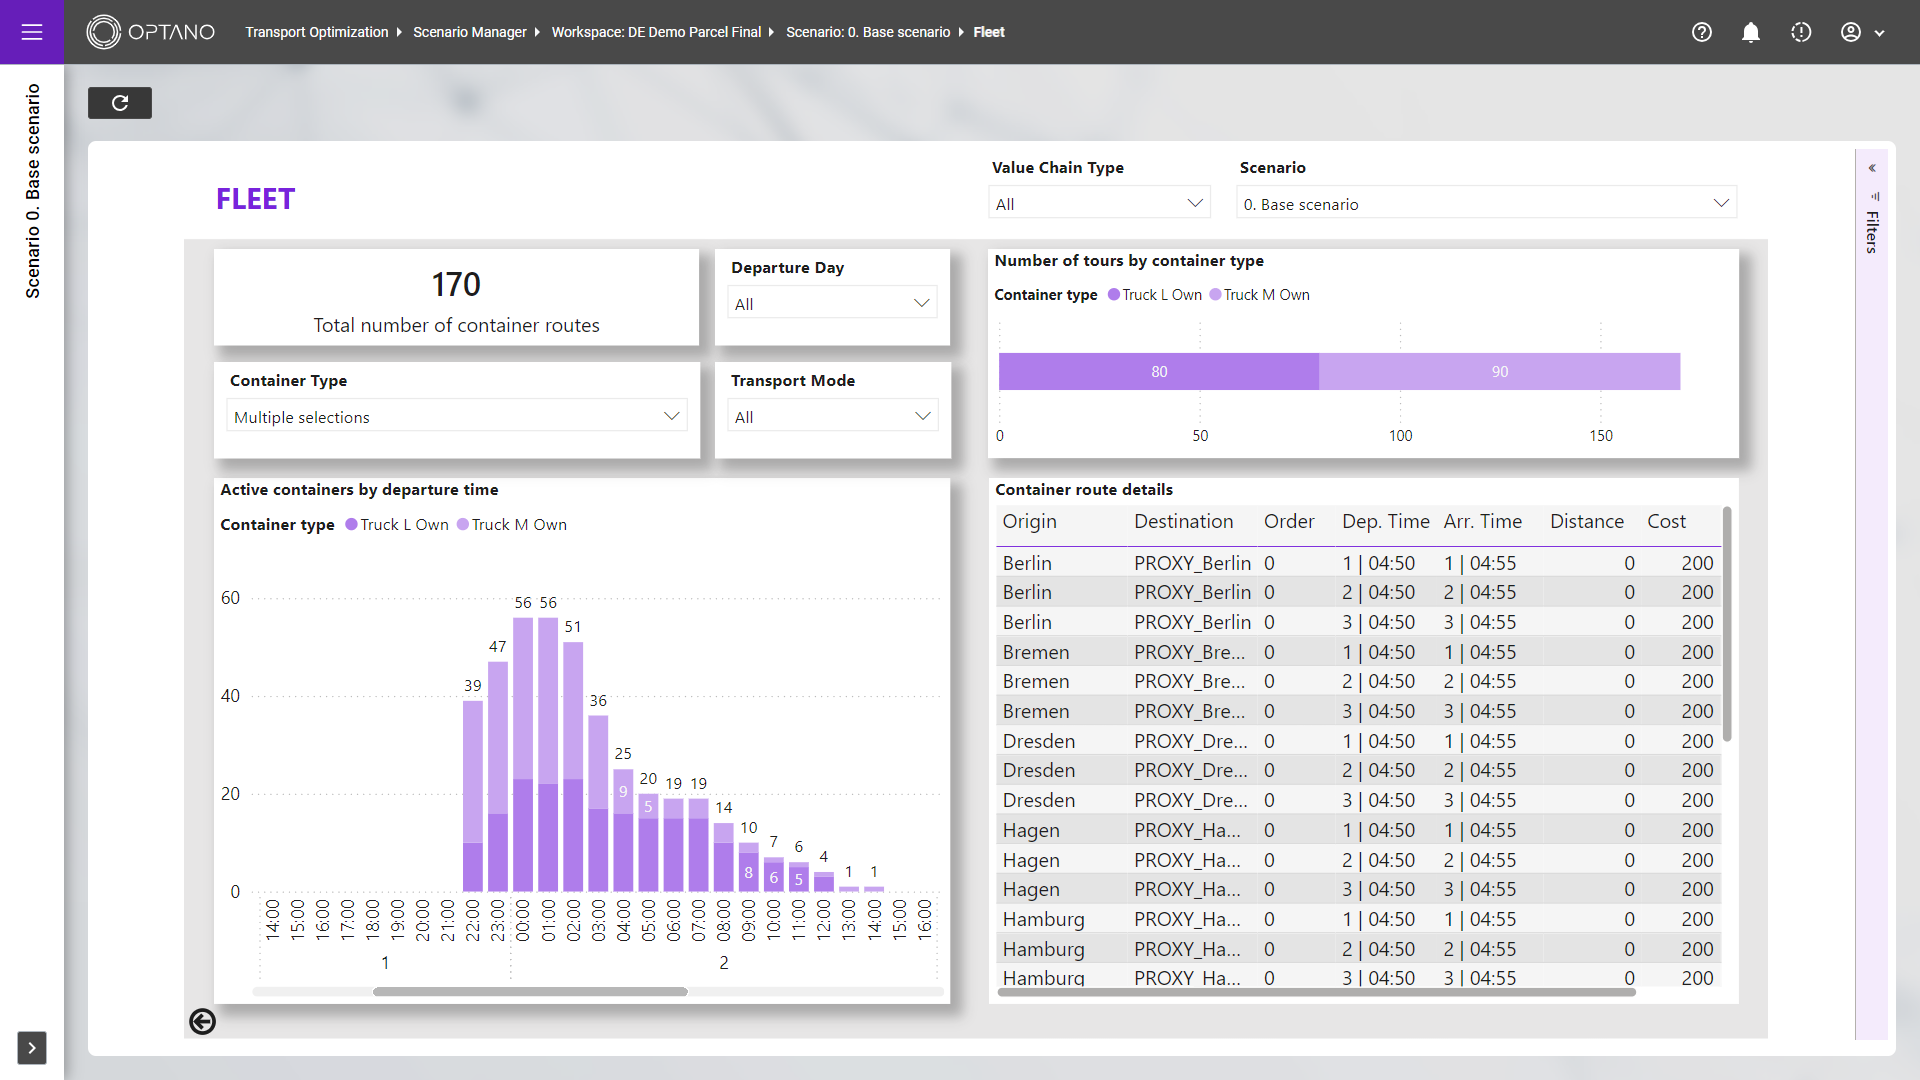
This functionality offers a comprehensive overview of linehaul operations across the network over a given period of time. It provides insight into the utilization and frequency of linehaul operations, enabling users to identify bottlenecks and potential capacity issues. It furthermore indicates the need for additional resources or collaboration with 3PL providers to address bottlenecks and allows to identify areas for process improvement.
Factors
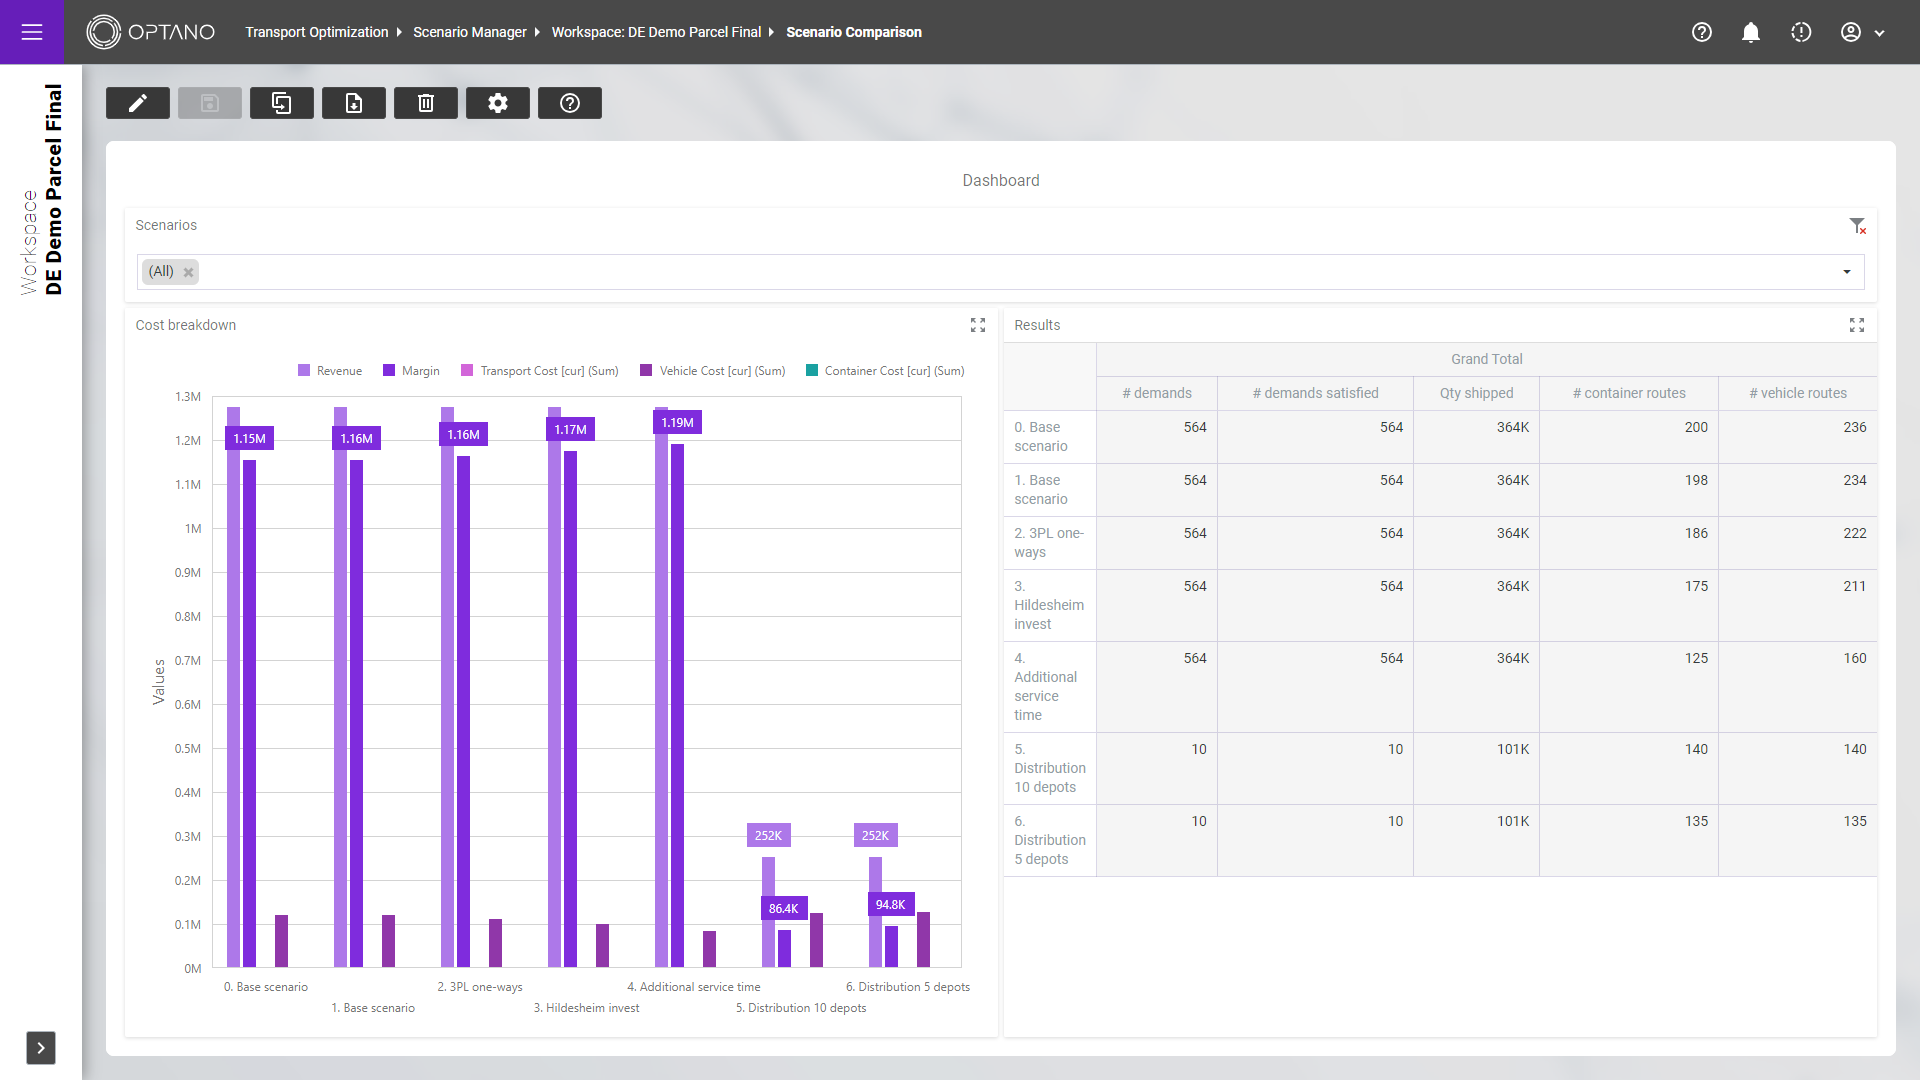
This feature enables users to effortlessly generate multiple scenarios with different degrees of freedom. Dashboards and tables facilitate a clear comparison between the results of different optimization scenarios. Moreover, individual decisions can be examined in greater depth and their impact evaluated. The distinct visualization of alternative decision options simplifies understanding the consequences of the decisions made.
Factors
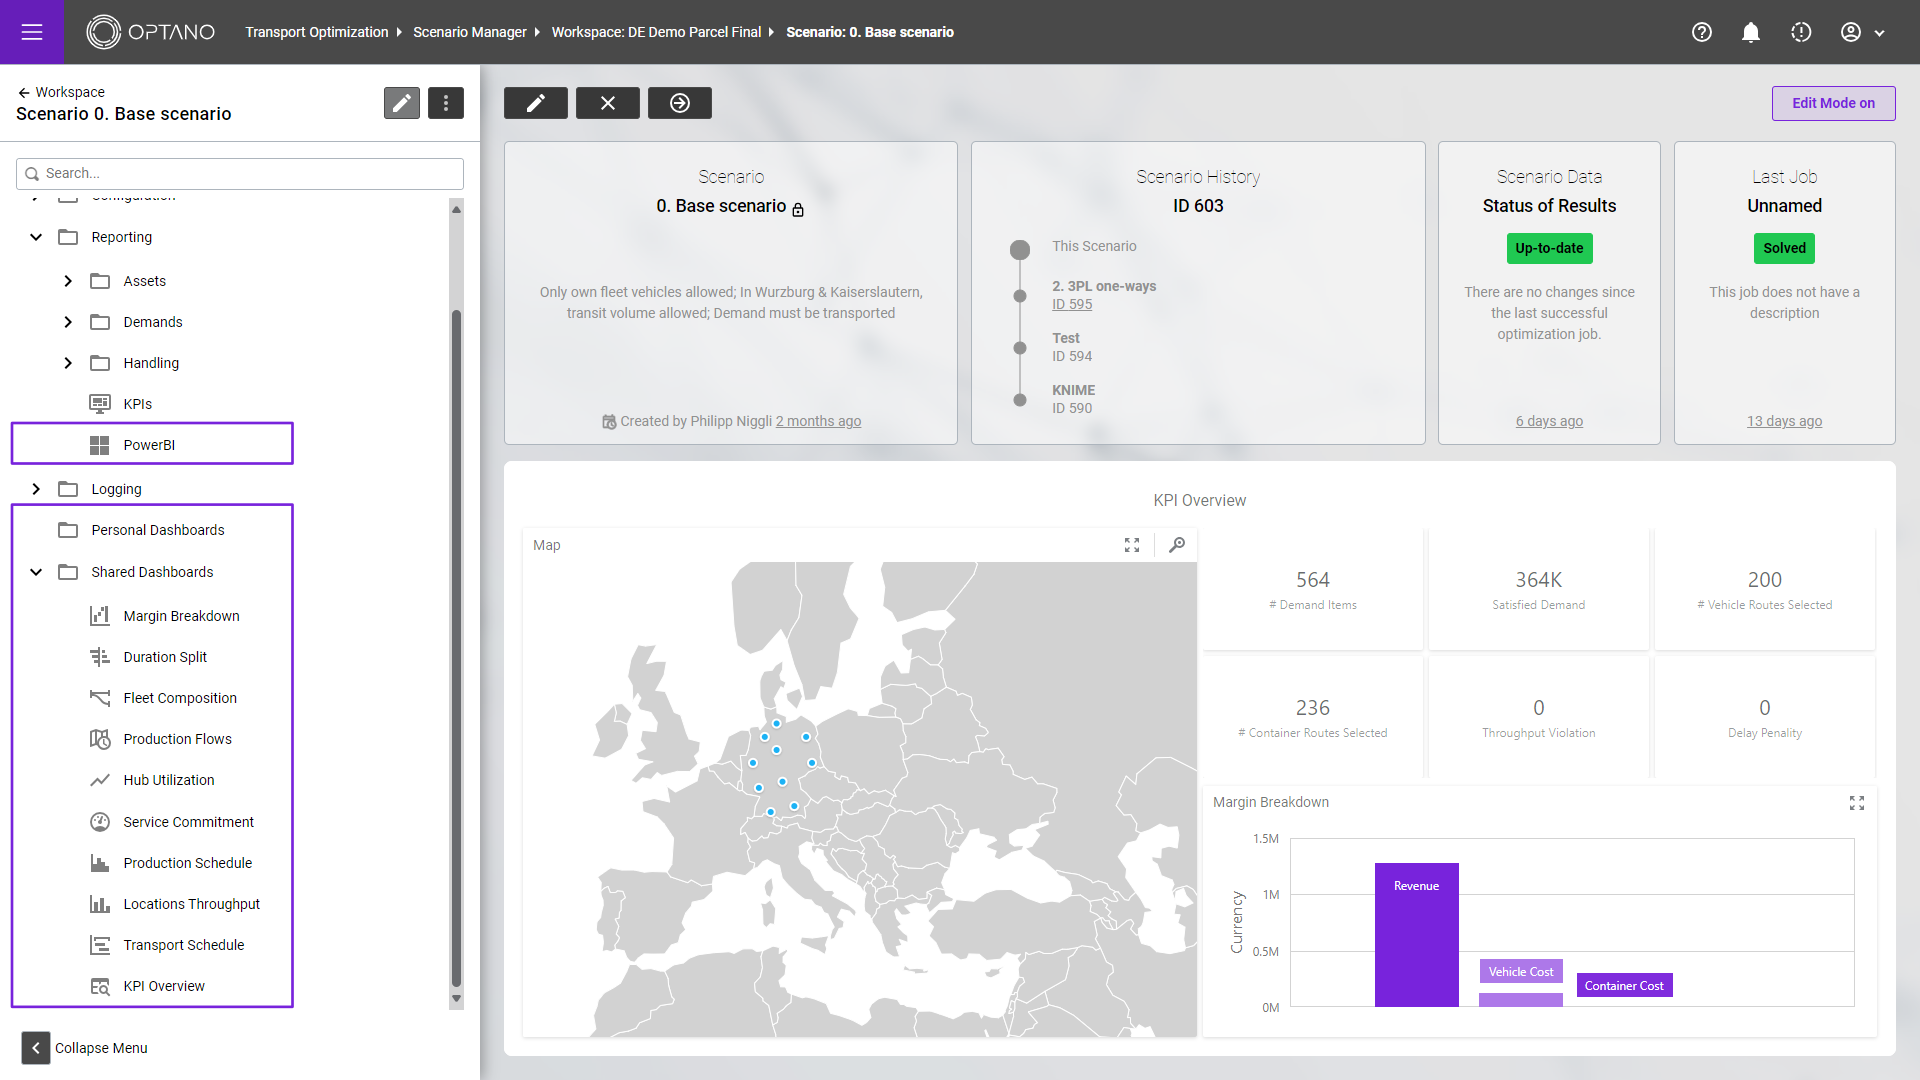
Users can create personalized dashboards by utilizing built-in DevExpress tools or an additional PowerBI module. Various output tables aid in comprehending optimization decisions and facilitate data exports for external analysis. This feature not only boosts transparency by delivering clear results but also fosters management involvement through straightforward data visualizations.
Factors
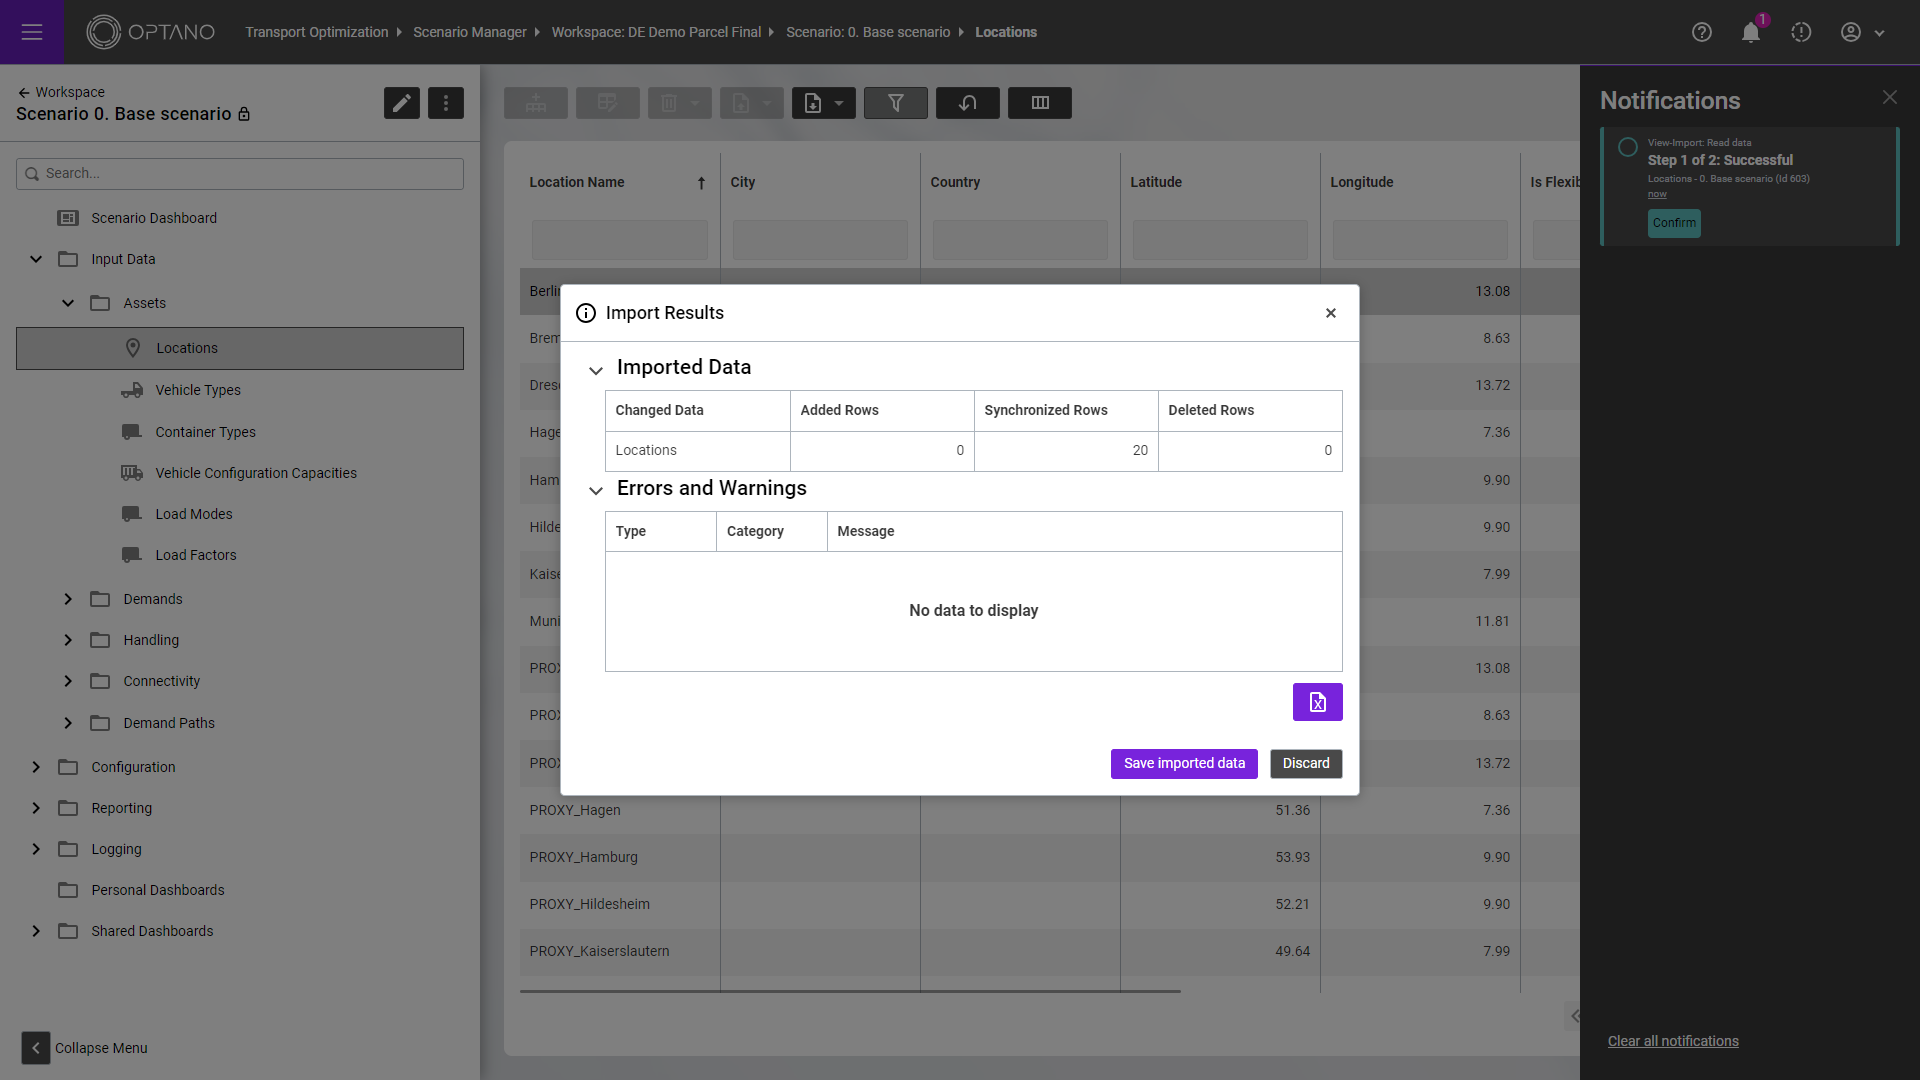
This feature allows users to effortlessly upload data for entire scenarios in a variety of formats, including XLSX and CSV. A comprehensive validation process ensures that data is accurate, minimizing errors and inconsistencies. This feature provides users with a time-saving method of entering data into the platform, thereby significantly boosting overall workflow efficiency.
Factors
Transparency in the
entire network
Holistic
optimization
Mathematical
decision support
Scenario
Management
Customizable
functions
Excellent
UI/UX design
Fast
results
Free choice
of solvers
How can we help you?
You are also welcome to use our contact form. We will then get back to you as soon as possible!
We look forward to talking to you!


